District Level Development of Jharkhand
According to the 2011 Census, the population of Jharkhand was 33 million, which is 2.7 per cent of the total population of the country. The states fares relatively better on some of the social development indicators as compared to other states, but for most of the other indicators it’s significantly lagging. While Jharkhand’s sex ratio (947 per 1000) is marginally higher than India’s (940 per 1000), the per capita state domestic product (Rs. 46,131/-) is significantly lower than all India average (Rs. 74,380/-). Despite the fact that per capita income of the state is higher compared to many other states, it is second poorest state in the country with almost 37 per cent poor compared to 22 per cent at all India level (Mehta & Singh, 2016).When we look at the indicators even deeper at the district level, significant differences exist across the districts.
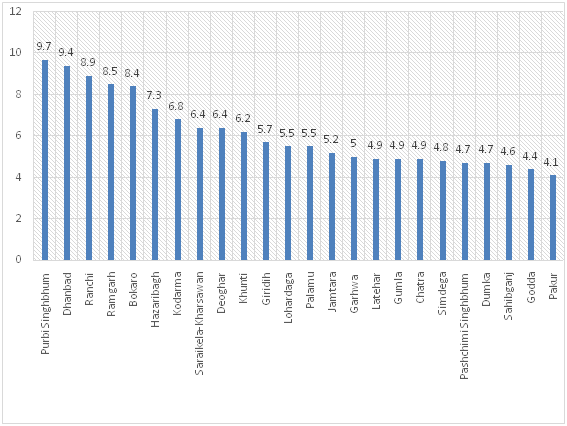
To further delineate this, we adopted a mix of UNDP and Government of India (Planning Commission) approach with some additional variables to create a composite human development index at district level. Jharkhand district level HDI has been calculated to examine the progress of districts in the state. Using this, the index suggests that Purbi Singhbhum stands at top among all the districts followed by Dhanbad, Ranchi, Ramgarh and Bokaro as developed with score HDI score between 7.5 and 10.
In the middle or under less developed category with HDI score between 5 and 7.5 are Hazaribagh, Kodarma, Saraikela-Kharsawan, Deoghar, Khunti, Giridih, Lohardaga, Palamu, Jamtara, Garhwa and Latehar.
In the bottom or less developed districts withHDI score less than 5 are Pakur, which holds the lowest index value followed by Godda, Sahibganj, Dumka, Pashchimi Singhbhum, Simdega, Chatra and Gumla.
Table 1: District Wise Level of Human Development Index of Jharkhand and Rank
District | Index | Rank |
Developed (7.5-10.0) | ||
Purbi Singhbhum | 9.7 | 1 |
Dhanbad | 9.4 | 2 |
Ranchi | 8.9 | 3 |
Ramgarh | 8.5 | 4 |
Bokaro | 8.4 | 5 |
Less Development (5.0-7.5) | ||
Hazaribagh | 7.3 | 6 |
Kodarma | 6.8 | 7 |
Saraikela-Kharsawan | 6.4 | 8 |
Deoghar | 6.4 | 9 |
Khunti | 6.2 | 10 |
Giridih | 5.7 | 11 |
Lohardaga | 5.5 | 12 |
Palamu | 5.5 | 13 |
Jamtara | 5.2 | 14 |
Garhwa | 5 | 15 |
Least Developed (Below 5.0) | ||
Latehar | 4.9 | 16 |
Gumla | 4.9 | 17 |
Chatra | 4.9 | 18 |
Simdega | 4.8 | 19 |
Pashchimi Singhbhum | 4.7 | 20 |
Dumka | 4.7 | 21 |
Sahibganj | 4.6 | 22 |
Godda | 4.4 | 23 |
Pakur | 4.1 | 24 |
Figure 1: District Wise Level of Development
Method that used to calculate the index
Table 1 presents available indicators of ‘well being’ as discussed above from secondary sources used to calculate the district level human development index. These are categorized into four broad categories.
- Standard of decent living:
(i) Monthly per capita expenditure as income proxy
(ii) level of living as proxy (households having wood roof and wall),
(iii) basic household amenities (household having electricity, drinking water, sanitation and telephone facilities); - Knowledge or Educational status:
(i) educational participation (children enrolled in and attending school) and
(ii) female literacy rate; - Healthy Life or Health status:
(i) infant mortality rate; - Other development indicators:
(i) urbanization rate;
(ii) financial inclusion (household having access to bank) and
(iii) per cent of Schedule Caste (SC)/ Schedule Tribe (ST) population and.
Variable | Description and Data sources |
Monthly per capita expenditure | Monthly per capita consumption expenditure (MPCE) calculated from consumption expenditure surveys of the National Sample Survey Organization, 2011-12. |
Level of living proxy | % of household having housing with mud wall & roof calculated form Population Census Abstracts, 2011 |
Basic household amenities | % households having electricity as primary source of lighting; access to drinking water within premises; sanitation facilities within premises; telephone facilities from Population Census Abstracts 2011. |
Educational participation | Attendance ratio of 5-14 years of age group calculated from employment and unemployment rounds of National Sample Survey Organization, 2011-12. |
Female literacy rate | Female literacy calculated form Population Census Abstracts, 2011. |
Health status | Infant mortality rate, from SRS Bulletin, Registrar General of India, 2012. |
Urbanisation rate | % population in urban areas calculated formPopulation Census Abstracts, 2011. |
% of SC/ST population | % of SC-ST population calculated form population census abstracts, 2011. |
Financial Inclusion | % of households availing banking facilities as financial development indicators calculated form Population Census Abstracts, 2011. |
The major sources of data used for the analysis are National Sample Survey Organization, 2011-12, Population Census Abstracts, 2011 and Sample Registrar System (SRS) Bulletin, Registrar General of India, 2012. The data of above indicators was collected for 24 districts of Jharkhand for the latest available years, which ranges from 2011 to 2013. Data for some of the newly created districts (like Ramgarh and Khunti) was not available and replaced by their original districts data for the analysis.
Each indicator was made unidirectional[2] and normalised by using average method[3], i.e. before calculating factor loading as a weight for each variable using principal component analysis. Further, the weight of each indicator has multiplied with its normalized value and composite development index is calculated by summing these nine values, which appears in Table 4 with their rank.
Conclusion
The human development status across districts of the state differs significantly. There are high developed districts such as Purbi Singhbhum, Dandbad, Ranchi, Ramgarh and Bokaro indicating better performance in terms of most of the development indicators ranging from urbanization to female literacy, while the least developed districts such as Pakur and Godda shown poor performance in terms of development indicators like female literacy, urbanization, electricity, sanitation and drinking water. Therefore, there is an urgent need for taking appropriate policy correction and action for improvement of these indicatorsfor the welfare of less or least developed districts. This will not only improve the well being of people residing in these districts but also enhance the overall development of the state. Lastly, the welfare of the people of a particular area cannot be measure by just one income indicator but it needs a combination of well being indicators.
NOTES
[1] Principal Component Analysis is a data reduction technique. It gives output in the form of eigenvalue and Factor Loading or Eigen Vector. The eigenvalue explain the variance in the variable, first component explains most of the variance. In standard practice components with eigenvalues more than 1 is chosen. The sum of eigenvalue is equal to total number of variables. Factor loading in the first component or second etc for each variable indicate the relative importance of that variable contributing to the objective. High factor loading explain stronger contribution and low suggests low contribution to the objective. So, one can select the important variables from this analysis.
[2] Unidirectional means making variables’values either in positive or negative direction like urbanization rate and female literacy rate is positive, while infant mortality rate and % of SC/ST population is negative. So to make all these variables either positive or negative is necessary before calculating index. The last two variables can be made positive by simply reversing – % non SC/ST population and children survival rate.
[3] Normalization serves the purpose of bringing the indicators into the same unit. Average method, i.e. variables value divided by the average value of state used to normalize the values.